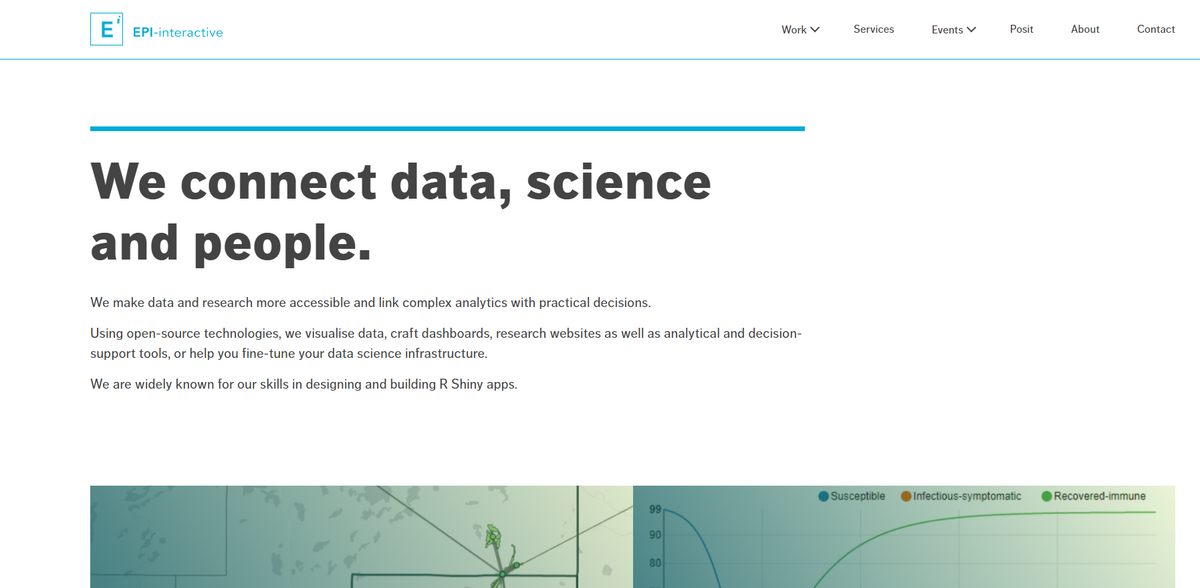
What is Epi-interactive?
Epi-interactive connects data, science and people. The organization makes data and research more accessible and links complex analytics with practical decisions. Using open-source technologies, it visualizes data, crafts dashboards, builds research websites, develops analytical and decision-support tools, and fine-tunes data science infrastructure. Widely known for designing and building R Shiny apps, Epi-interactive has grown through the years while remaining dedicated to transforming scientific insights into practical, user-friendly solutions. With 15 years in business, the company embraces change and evolving technological advancements in data science, bringing innovative ideas to life.
Main Benefits
- 15 years of commitment and growth – the same team with a new face.
- Expertise in animal health data, environmental health data, and epidemiology.
- Mastery in app design, dashboard creation, and spatial data visualisation.
- Specialization in R shiny, RStudio, and RStudio connect for effective solutions.
- Proven experience with projects like AIS Explorer, Epidemix, WHO GLASS dashboard, and Cancer Care Data Explorer.
- Support for scientific research and policy-driven initiatives.
Cutting-Edge Data Visualisation
Data visualisation sits at the very heart of what Epi-interactive does – from rendering complex datasets into intuitive dashboards to enabling communities to understand and act on health science insights. The approach is both dynamic and accessible, ensuring that decision-makers can see trends and patterns at a glance. This method not only emphasizes clarity, but also the power of data to forge practical decisions. Every element of the design reflects a meticulous attention to detail in transforming abstract numbers into relatable visuals.
Technological Excellence
The projects delivered by Epi-interactive showcase a synergy between technology and science. With an enduring reputation in designing R Shiny apps, the organization leverages cloud hosting and software development expertise to fine-tune RStudio environments, making sure that every tool is deployed efficiently. Whether it comes to building interactive dashboards or executing spatial data visualisation, the technological excellence remains front and center. It is a place where data science infrastructure is not just built; it’s perfected to drive real results.
Innovative Research Support
Epi-interactive’s portfolio spans multiple groundbreaking projects that bridge science and policy. The AIS Explorer, a science-supported biosecurity decision-making project, harnesses the potential of animal health data and environmental health data to provide reliable insights. In parallel, Epidemix stands as an exemplar for linking science with policy, underscoring the importance of epidemiology in guiding public decisions. Projects like the WHO GLASS dashboard and Cancer Care Data Explorer further elevate performance indicators and global health insights, ensuring that data is not just collected but transformed into actionable knowledge. The incorporation of open-source tools creates an ecosystem where innovation and research support work hand in hand.
Engaging Projects & Initiatives
The portfolio of projects is a testament to the firm’s deep commitment to research and innovation. AIS Explorer delivers vital decision-making support for biosecurity, while Epidemix bridges the gap between scientific research and impactful policy. The WHO GLASS dashboard provides insights into global health issues as never seen before, and the Cancer Care Data Explorer takes performance indicators to the next level. This diverse range of offerings embodies a vibrant mix of animal health data, spatial data visualisation, and environmental health data, ensuring that their expertise adapts to different contexts and challenges. It’s a vibrant environment of collaboration and constant evolution – a place where precision meets passion… and results speak for themselves.
Project Impact
- Good Health and Well-being
- Industry, Innovation and Infrastructure
- Sustainable Cities and Communities
- Reduced Inequalities
Future Prospects
Epi-interactive’s journey continues to expand with upcoming events that showcase its ongoing dedication to data science in a world of rapid change. The future brings opportunities like the free online webinar “Enabling successful open-source data science in restricted environments” on 28 April 2025, the much-anticipated in-person R Exchange 2025 on 15 May 2025, and a yet-to-be-announced online Masterclass on R Shiny. These events are set to inspire, educate, and engage participants in the emerging technologies and applications that define modern science dashboards and software development practices. Casual yet insightful, each event is designed to offer a deep dive into the realms of app design and cloud hosting while reaffirming the commitment to leveraging open-source technologies. With continued advancements and a robust BCorp score of 80.2, Epi-interactive remains at the forefront, ready to tackle new challenges, celebrate its milestones, and continue making data and research more accessible. The natural flow from data to decision is clear – a blend of creativity and technical acumen drives the organization’s every effort into a brighter, more data-driven future.