What is the [ui!] UrbanPulse Project?
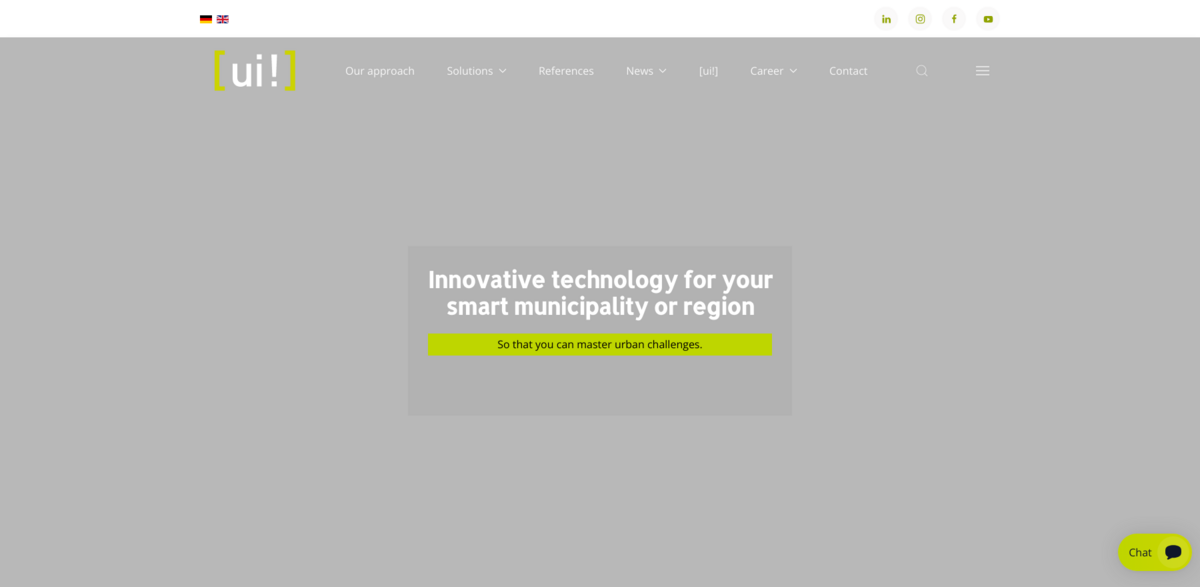
The [ui!] UrbanPulse project is all about bringing innovative technology to your smart municipality or region, helping to tackle urban challenges head-on. At its core, it’s an open urban data platform designed to be the foundation of any smart city strategy. Cities, municipalities, and districts collect tons of data through digital infrastructures—think intelligent street lighting, traffic lights, and other sensor systems. This data is then gathered via various connectors and funneled into the [ui!] UrbanPulse platform, which links a wide variety of IT systems together. The platform doesn’t just collect data; it gives decision-makers the power to choose which data to process and share, making digitalization efforts more effective and transparent.
Main Benefits of the [ui!] UrbanPulse Platform
Here’s why [ui!] UrbanPulse stands out as a game-changer for urban digitalization:
- Centralized collection and processing of anonymized urban data from multiple sources
- Real-time data integration through a multitude of connectors
- Open platform ensuring data sovereignty remains with the client
- Visualization tools like [ui!] COCKPIT to engage citizens and promote transparency
- Enables third-party providers to offer intelligent services, creating new business models
- Supports creation of “smart data” with low latency, forecasting ability, openness, security, and standardization
Where Does the Data Come From?
Data originates from the digital infrastructure embedded in cities, municipalities, and districts. Sensor systems—such as intelligent street lighting and traffic lights—continuously collect information. This raw data might seem like a chaotic mass at first, but once it’s structured and refined on the [ui!] UrbanPulse platform, it transforms into valuable information. This structured data lays the groundwork for insightful analysis and innovative services that ultimately benefit citizens.
How Does Data Visualization Work?
Once the relevant data is selected and processed, it can be visualized through the [ui!] COCKPIT. This tool allows municipalities to share information transparently with their citizens, fostering dialogue and demonstrating the tangible benefits of data collection. The “pulse” symbol seen on many [ui!] COCKPITs represents the continuous flow of high-quality, frequently updated data. The stronger and greener the pulse, the more robust the data collection and processing efforts are.
Understanding Data Sovereignty and Security
Data sovereignty is a big deal here. As the owner of vast amounts of urban data, cities and municipalities must maintain control over their information. The [ui!] UrbanPulse platform ensures this by providing integrated, open, and real-time access to data, along with analysis tools. This setup not only offers a comprehensive overview of data usage but also minimizes the risk of misuse. In other words, the data always stays in the right hands.
Project Impact: Linking to Sustainable Development Goals (SDGs)
- SDG 11: Sustainable Cities and Communities – promoting smart, resilient urban environments
- SDG 9: Industry, Innovation, and Infrastructure – fostering innovation through digital infrastructure
- SDG 16: Peace, Justice, and Strong Institutions – ensuring transparent data governance and sovereignty
- SDG 17: Partnerships for the Goals – enabling collaboration between municipalities, service providers, and citizens
Promoting Digitalization in Communities
The [ui!] UrbanPulse project supports cities, communities, counties, and regions in their digital transformation journey. By collecting, processing, and analyzing all existing and anonymized urban data on a central platform, it opens doors for new services and added value. Utility companies and local authorities can leverage this data to innovate and improve citizen services. Plus, the platform’s open nature means it’s adaptable and ready for future smart city developments—making digitalization not just a goal, but a sustainable reality.

