What is Ecoten?
Ecoten is a professional consulting company in the field of energy, environment, and management. The project, showcased through its website at ecoten.cz, delivers high-quality expertise and comprehensive solutions designed to optimize energy performance and promote sustainable practices. With an emphasis on quality and innovation, Ecoten not only provides expert advice but also tools to navigate the complexities of energy efficiency. Located at U Zvonařky 994/15, 120 00 Prague 2, Czech Republic, the organization connects advanced consultancy with a clear mission – to steer the industry toward a greener future… With a clean, user-friendly website layout and detailed information on their services, Ecoten ensures transparency and reliability for its clients and stakeholders.
Main Benefits and Key Figures
Key facts reflect the impactful nature of the Ecoten project, showcased through easily accessible figures and benefits. The platform organizes vital information so that users can quickly understand the scope and scale of the services offered. A few highlights include:
- Number of Projects
- Saved Energy (MWH)
- Realized Subsidies
Wide Range of Services
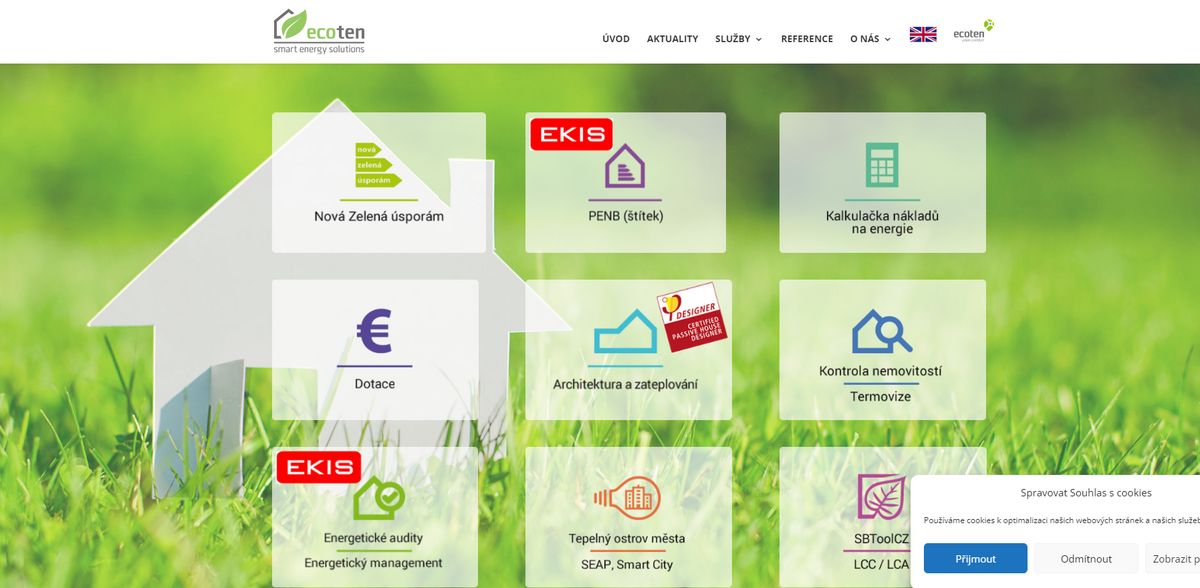
Ecoten supports its mission with a diverse suite of services that target different aspects of energy management and sustainable building practices. One prominent section, “New Green Savings” (accessible at New Green Savings), provides a host of expert solutions such as the PENB (Energy Performance Certificate) service, a dedicated calculator tool, information on available subsidies, and various inspection services. Additional services include comprehensive offerings in architectural planning and insulation, detailed energy audits, LCC/LCA studies, as well as initiatives linked to Urban Heat Island research and Smart City solutions. With resources broken down and organized clearly on the site, the project offers a one-stop destination for energy efficiency and management insights.
User Engagement and Reliable Information
The content structure of the Ecoten website illustrates a strong commitment to clear communication and dependable consultancy information. Visitors can easily navigate from the home page to sections like Introduction and News, ensuring that those seeking current updates are always informed. The project also features informative pages such as References and About Us, which includes dedicated sections like Our Team and Support, as well as a Contact page designed to simplify communication. The use of dynamic language and engaging visuals like the Ecoten logo enhances the experience, while the availability of social media links – including a Facebook page and a LinkedIn profile – reinforces community engagement and transparency.
Detailed Project Information
Beyond the immediate benefits, the project layers in further details that enrich its credibility. With clear segmentation into services such as energy audits and property inspections, the project emphasizes a commitment to reducing energy consumption and maximizing operational efficiency. For example, the inclusion of advanced tools like the energy calculator and specific subsidy services gives users insight into the practical steps of energy management. The careful presentation of each service, coupled with real-life application through references and case studies, offers a tangible demonstration of the project’s impact. The careful curation of content is a hallmark of Ecoten’s approach to consulting, ensuring every user feels well-informed and empowered to make greener choices.
Contact and Communication
Direct communication is a cornerstone of the Ecoten project. Located in the heart of Prague at U Zvonařky 994/15, the organization maintains an accessible and open line through multiple channels. Interested parties can reach out via phone at +420 736 630 021 or via email at info@ecoten.cz. The website is a reliable source of detailed information and is regularly updated to reflect new developments in energy consulting and environmental management. This transparent approach to contact details, coupled with the ease of navigating social media platforms like Facebook and LinkedIn, reinforces trust among clients and creates an inviting environment for further inquiry.
Project Impact on Global Sustainability
- SDG 7: Affordable and Clean Energy – Emphasizing improved energy efficiency and access to sustainable energy.
- SDG 11: Sustainable Cities and Communities – Contributing to the development of more resilient and eco-friendly urban environments.
- SDG 13: Climate Action – Supporting initiatives aimed at reducing greenhouse gas emissions.
- SDG 12: Responsible Consumption and Production – Promoting efficient use of resources and waste reduction.
- SDG 9: Industry, Innovation, and Infrastructure – Enhancing innovation in energy management and sustainable infrastructure development.
Ecoten’s Vision for the Future
Ecoten’s vision encompasses a future where energy consulting is synonymous with sustainable progress and environmental stewardship. The project combines advanced analytical tools with deep industry knowledge to drive forward-thinking energy solutions. Clean energy and sustainable practices are not only buzzwords here – they are embedded in every service offered, from property inspections to detailed environmental audits. In a world where everyday decisions can lead to lasting impacts, the project serves as a key example of how rigorous professional consulting can evolve alongside dynamic industry trends. The approachable yet authoritative style mirrored on the website invites both industry insiders and interested newcomers to explore, learn, and contribute to a sustainable transformation… As new challenges arise, Ecoten remains agile, continuously enhancing its services to serve the community and environment better.

